Introduction to Reports
Reports: Unlock Insights to Optimize Your Platform
Reports are a powerful tool for understanding user interactions on your platform. For example, you can easily track learner progress across all your courses. This allows you to identify patterns or potential bottlenecks and refine course curriculums as needed.
Additionally, reports provide a clear view of your revenue, enabling you to leverage data to boost earnings effectively.
LMS Reports
For learner and course-related insights, the following reports are available:
- Course Overview: Summarizes course performance and learner engagement.
- Learning Path Overview: Tracks progress and completion rates across defined learning paths.
- Course Insight: Delivers detailed analytics on individual courses.
- Student Insight: Offers a comprehensive view of learner activity and performance.
- Learning Path Insight: Provides deeper analysis of learner progress within specific paths.
- Survey Report: exports a report of Student's Survey responses if you're using Survey modules to collect feedback.
If you are using Portals, you can filter the Overview, Course and Learning Path Insight reports to view data specific to each portal.
eCommerce Reports
For eCommerce performance, the following reports are available:
- Yearly Sales: Tracks annual revenue trends.
- Monthly Sales: Breaks down revenue by month.
- Product Breakdown: Analyzes sales by product or course.
- Export Orders: Generates detailed order data for export.
- Cart Abandonment: Highlights lost opportunities from incomplete purchases.
Site Audit Report
This Site Audit Report to view activity on the platform.
Each of these reports can help you quickly organize and visualize the data for both your Courses and your platform.
Learn more about each of these categories of reports in the associated guides:
- Pulling Student and Course Reports
- Pulling Revenue and Order Reports
- Viewing the Audit Log Report
- Pulling Portal Reports
- Pulling Learning Path Reports
- Pulling Survey Report
- Pulling Quiz Analysis Report
User Metrics
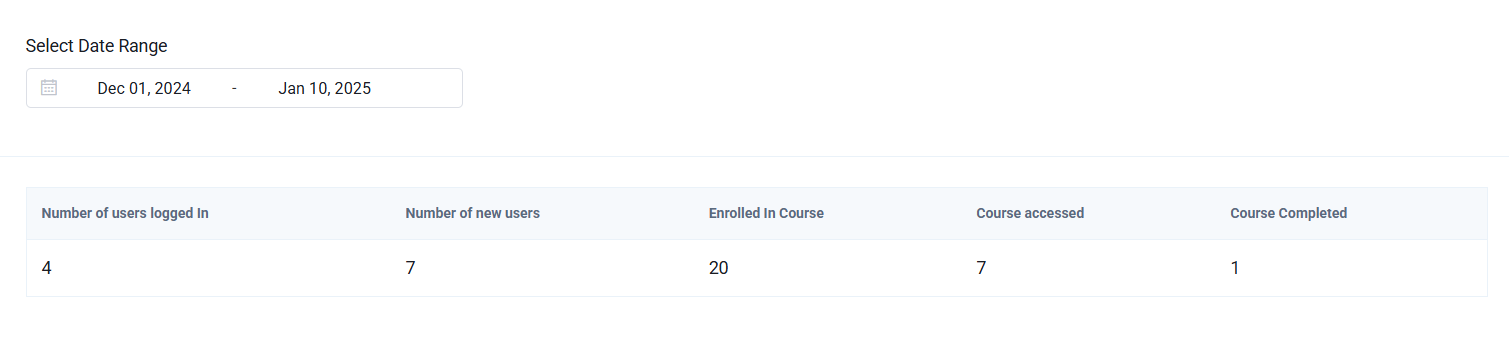
This section presents a summarized view of key user engagement metrics within a selected date range. The displayed data is based on user interactions on the platform, such as login frequency, new registrations, and course-related activities.
Key Metrics:
- Number of Users Logged In: A total of users accessed their accounts during this period, showcasing active engagement within the selected date.
- Number of New Users: The total number of new users who registered on the platform during this period.
- Enrolled in Course: The total number of users who enrolled in courses, demonstrating strong enthusiasm for learning.
- Course Accessed: The total number of courses actively accessed by users, reflecting consistent participation.
- Course Completed: The total number of users who successfully completed a course.